Climate risk, in practice, is tricky business.
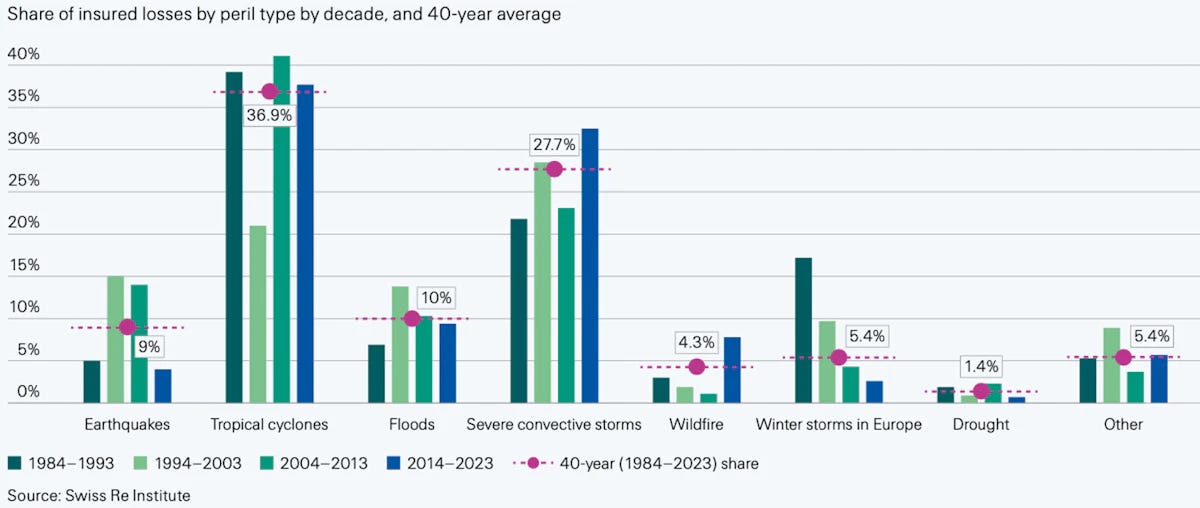
Look at this graph from Swiss Re showing an 8% rise in insured loss for severe convective storms (SCS) in the last 12 years. If you read the news, increased disasters and losses are attributed to climate change, but the insurers high-level estimate of climate change attribution is only 1% (of 8% annual increases).
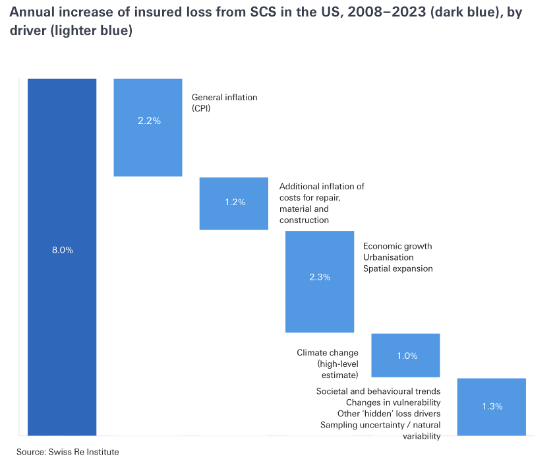
In this post I will take a deep dive into what the 1% figure means in practice and peel the layers of weather disaster risk by looking at a specific catastrophe as an illustration, landslides in Brazil, that hit me and my family while on vacation last year.
To put this Brazilian disaster in perspective here’s a graph of global insured losses by peril type (shared by Patrick Brown with data from Swiss Re). Storms, like the one I experienced in Brazil, are responsible for the second most losses (27.7%) globally, second to cyclones/ hurricanes (36.9%), and increasingly so in the last 10 years.
Why is discerning climate risk so tricky?
On the one hand is the evolving reality of climate change, which implies keeping up with a changing climate (a moving target) as well as our evolving knowledge of climate science.
Consider the IPCC and its “simultaneously indispensable and near impossible” task of delivering relevant scientific information on climate change:
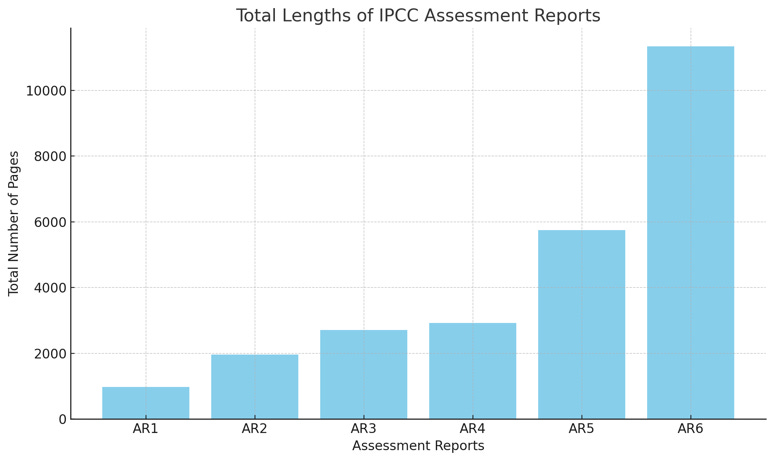
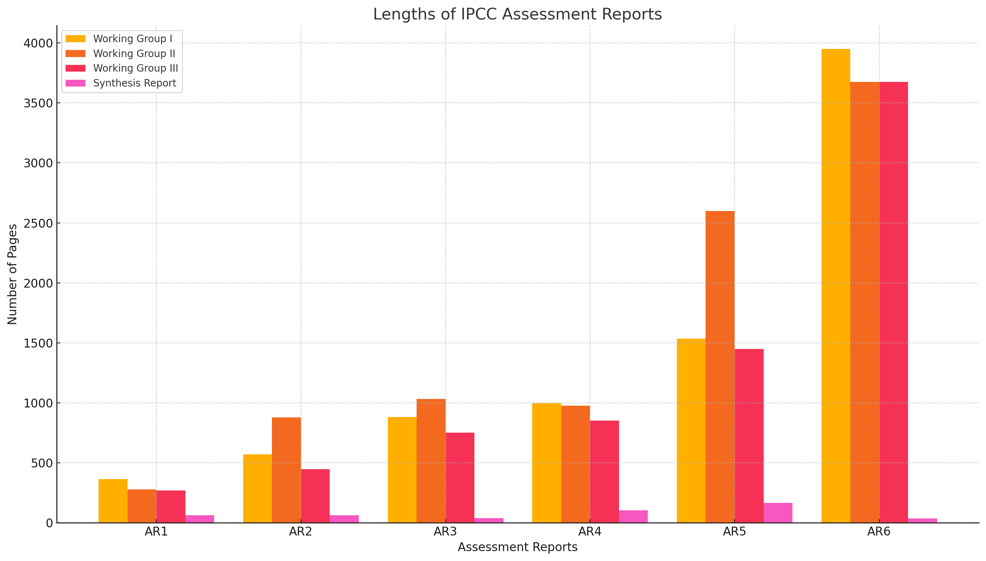
The last report concluded in 2023 (AR6) took 8 years to publish more than 11,000 pages stitching together contributions from three workings groups comprised of 782 scientists who assess all the relevant existing literature on climate science.[1]
Here is the graph showing the total lengths of each IPCC Assessment Report (AR1 to AR6) in terms of the number of pages. This visualization provides a snapshot of how these reports have evolved over time.
Here is the graph showing the lengths of the IPCC Assessment Reports (AR1 to AR6) by their respective sections:
But climate change is only a part, and many times not the most important part, of weather disaster risk. When a weather hazard – which may be a result of anthropogenic emissions but also natural variability like El Niño - impacts a region, the specific exposure and vulnerability of structures and people is often a much bigger cause of disaster damages.
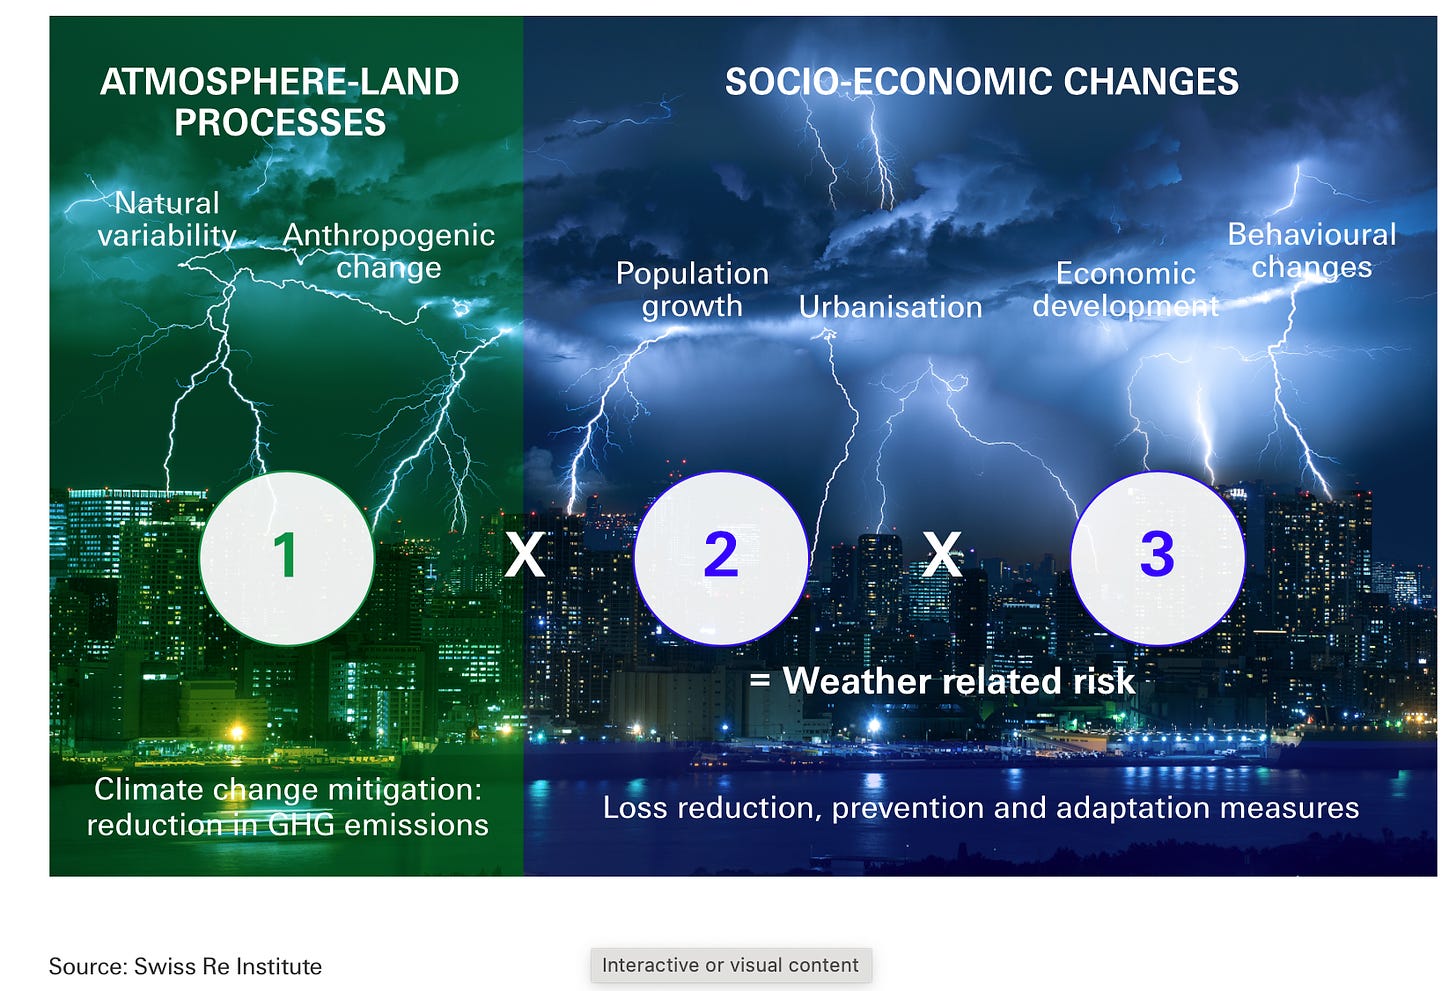
As I wrote,
The cast of characters in a disaster is well established, comprised of components and their associated drivers. Any natural disaster is comprised of three components: the hazard, exposure and vulnerability. Each component in turn is affected, or motivated, by drivers.
I recently posted about flooding in Brazil in May, 2024, that left almost 600,000 people displaced, 77,000 rescued, 800 injured and 169 dead (see official data here). It’s a terrible tragedy that has mobilized the nation.
If the Brazilian landslides were a movie and the disasters causes were personified by actors, the Oscars would nominate best actresses and supporting actors. While the media and science activism overwhelmingly promote climate change at the lead actress in every single weather disaster, many times the lead actor is vulnerability or exposure.
The media always tells you climate change is Katherine “Climate” Hepburn (most lead actress Oscars of all time) when climate is often Walter Brennan (most supporting actor Oscars of all time). Never heard of Brennan? That’s my point.

The true Katherine Hepburn, the star of disaster risk, is socio-economic (exposure and/or vulnerability). The prevailing narratives want you to believe climate change, Walter Brennan, is a lead actor. Don’t be fooled.

Obscuring the lead actor/actress is only the first move in climate (mis)communication. The, at best, apparent confusion and conflation between factors and drivers of weather disasters plays into a much bigger story: climate scapegoating. (I will develop climate scapegoating in another post.)
Below, I want to illustrate the consequences of climate disaster conflation in practice.
Disasters up close and personal
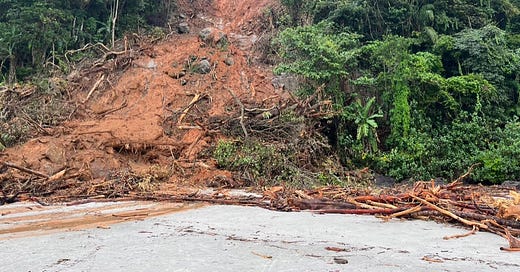
Last year I was an eyewitness to a weather disaster in São Sebastião, Brazil, during Carnival in February of 2023 (disaster pictures my own).
Intense rains led to landslides and flooding, displacing 2, 500 people, killing 65, and thousands more lost homes and goods, leading to an estimated total damage of R$600 million (about USD $120 million). The navy parked a warship to assist in relief efforts, the president flew over in a helicopter, donations poured in from across the nation.
For context, for many people São Sebastião is to the mega city of São Paulo (pop: 22 million) what the Hamptons is to New York city – an enticing holiday refuge a few hours’ drive away. (But Brazil is no USA, and one factor critical to this disaster, as we will see, is the role of poverty in vulnerability – almost all the people who died were poor.)
The city of São Paulo, with more people than the next most populous state in Brazil (Minas Gerais, 20 million), is also the engine of the “locomotive of South America”: the State of São Paulo, 21st largest economy in the world ($603 billion, larger than Argentina or Belgium) and 1/3rd of Brazil’s total GDP.
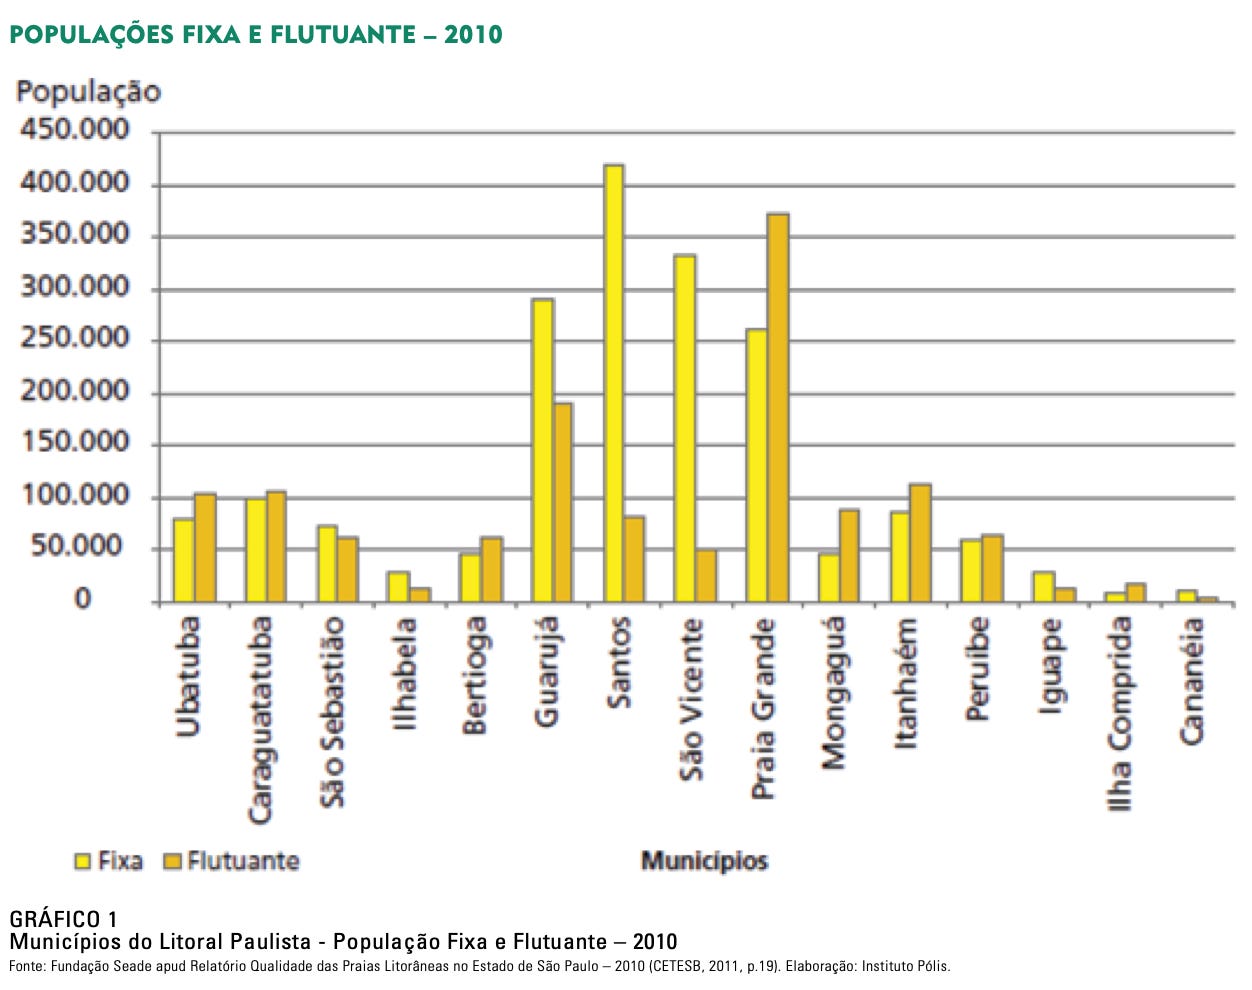
That means a lot of people (and money) flocking to the beach on weekends and holidays, like Carnival when the disaster happened in February of 2023. Here’s a graph showing the population fluctuations between locals and tourists on the state of São Paulo’s coastal municipalities (in geographical order from north to south).
Credit: Polis.gov
The municipality of São Sebastião is not the most populous (82 000 people sparsely distributed) but arguably the most beautiful along the already spectacular coastline from Santos to Rio de Janeiro, hosting tropical beaches and the Atlantic Forest, a unique and threatened ecosystem that doesn’t get as much attention as the Amazon, but it should (and not only because I grew up here).
Sidenote: I am keenly interested in urbanization trends in this area- my first ever research project, when I was 17 years old, is a study of urbanization in the town of Boiçucanga (a locals’ town next to Maresias, home to 3 times world surf champion Gabriel Medina. I digress…)
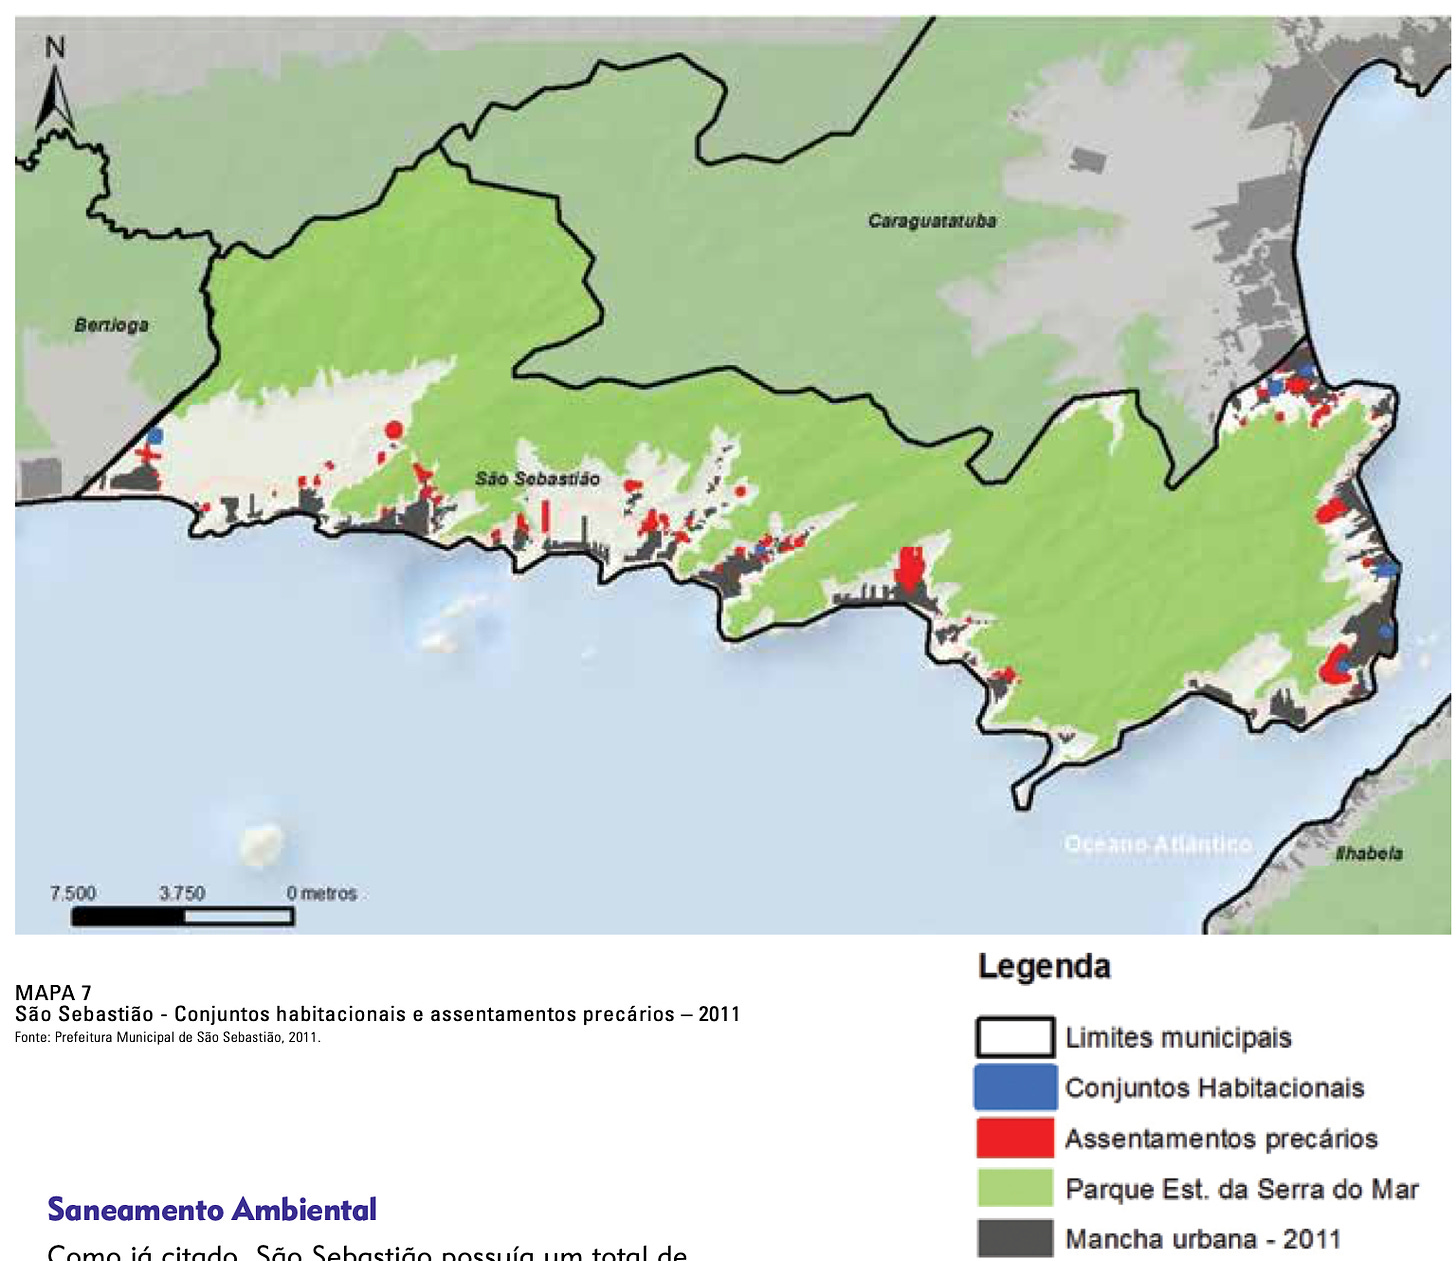
The maps below show the urban areas in São Sebastião municipality in purple surrounded by Atlantic Jungle, and notably include an indigenous reservation (which I have had the pleasure to visit) and a port. The map below (from 2011) shows urban settlements in precarious and high-risk areas.
Credit: Polis.gov
The facts
On Saturday Feb. 18, 2023 street carnival kicked off, and we were dancing on the streets. (Look at my moves).
At night the rain began, and 415m in 10 hours/ 613 mm in 24 hours poured down from the sky. The rate of rain is not unprecedented for this region, but that rate of precipitation for that long of a period exceeds recorded history (more on that below).
I woke up early to check the surf, and the beach looked like a scene from Normandy invasion on D-Day (minus the dead bodies), with debris littered everywhere. Sadly, there were dead bodies not far away.
A child in a house one block away was killed overnight from a mudslide, and I went to check on a friend whose family lives on a steep hillside – he wisely bailed with his kids overnight.
All of my friends were safe, but 65 people died that day, mostly in Vila Sahy, two neighborhoods away. All highways were blocked, and we were cut off by land, phone and internet for days, rationing for water and food. Helicopters were landing on the soccer field charging $1000’s for the rich to be evacuated while everyone else looked on – not quite the fall of Saigon, but it may have felt that way for those who were injured and left behind.
Climate science
When I read that the São Sebastião deluge was the greatest rainfall in Brazil’s history, that didn’t sound right. If there is something I learned about growing up in Brazil, is that heavy rains, flooding and landslides are usual occurrences, especially in the Mata Atlantica.
There is a very good recent paper discussing the disaster in São Sebastião that states:
“Disastrous (multi-hazard) events are not unknown in the region, e.g. the Caraguatatuba disaster in 1967, where rainfall of 585 mm in 48h triggered more than 640 landslides and debris flows(Dias et al., 2016). Therefore, while the 2023 event was an extreme and rare event with a return period of 420 years, it cannot be said that the event was entirely unprecedented.”
You can read the whole paper, and you will find that the rainfall records for the region are limited. Still, it is very possible that the 2023 Carnival in São Sebastião is the actual (and not only recorded) regional, or even national, 24-hour precipitation maximum.[2]

For an extensive discussion of rainfall trends and climate change in the IPCC reports in southeast Brazil see my previous post. The short answer: there is no present detection of climate change as a driver for mean or extreme precipitation increases (either globally, or in southeast Brazil), though climate driven increases are expected by 2050 and beyond (see IPCC graph below).
Before I move from rainfall to landslides, I just want to reference the 1967 disaster in Caraguatutba (the neighboring municipality to São Sebastião) which had very similar characteristics and triggered more landslides (640 vs 571) than the 2023 disaster and caused more fatalities (120, and other sources site almost 500 deaths in 1967).[3]
In a previous post I shared the IPCC table (WGI IPCC report pg. 1856) about climate impact driver’s (CID) for all weather events and corresponding detection and attribution, highlighted again below.
What is notable in the graph above is no detection or attribution now or ever expected for landslides globally. If we look at southeast Brazil specifically, climate change is not projected to be a driver of landslides, though there is medium confidence for heavy precipitation increase and high confidence of mean precipitation increase. See the IPCC table 12.6 below:
You can read in chapter 12.4 (WGI report linked here) about mean and extreme precipitation, landslides and flooding for yourself in the IPCC report (southeast Brazil is designated as SES region).
In conclusion, climate change was all over the news as the cause of the landslides,

yet the IPCC offers no detection or attribution for landslides globally, and there is uncertainty about the role of climate change on the disaster in São Sebastião.
On the other hand, we have a lot more certainty about the role of exposure and vulnerability in the disaster that killed 65 people.
Exposure
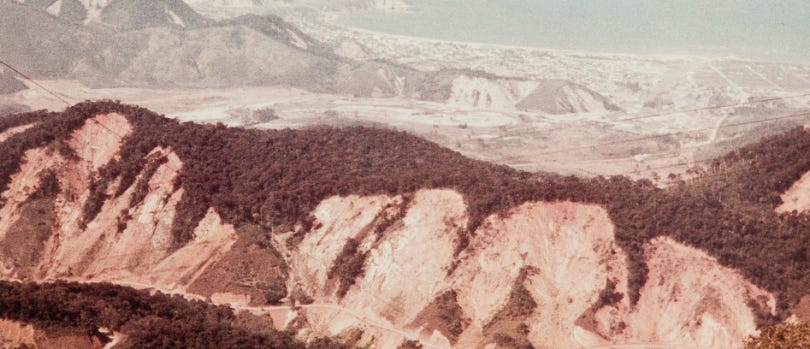
In the last decades São Sebastião has experienced tremendous population and property growth. Exposure to disasters, like landslides, has increased. In 1970, the population of São Sebastião was 12,000 compared to 82, 000 today. Much of the growth is explained by a highway linking São Sebastião to the megacity of São Paulo, concluded in 1985.
The image below shows property growth from 1985 to 2015. “B” on the image is where most of the deaths occurred in February of 2023, in Vila Sahy. The 2023 disaster damage overwhelming occurred on urban areas developed after 1985.
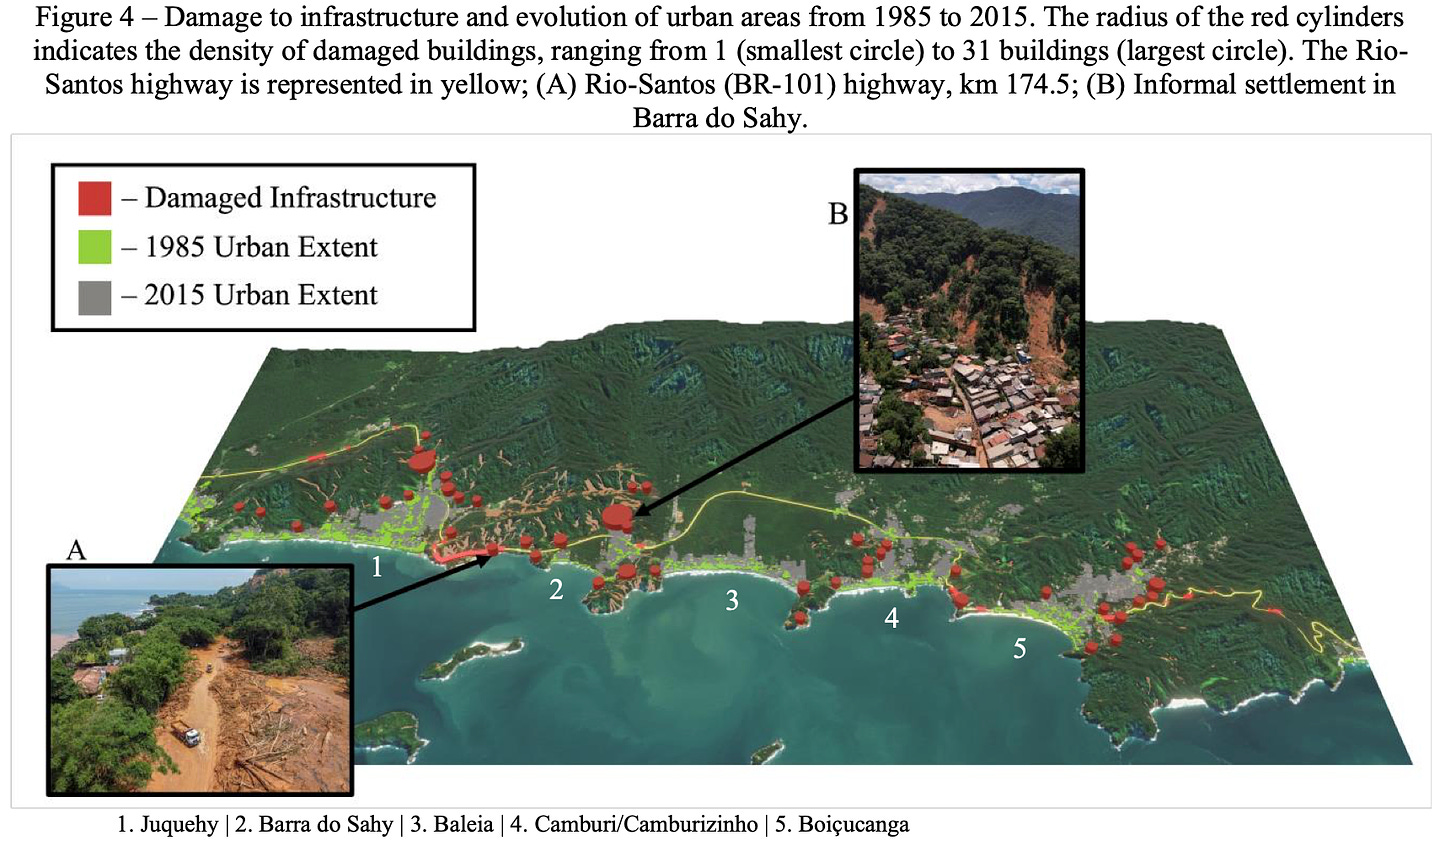
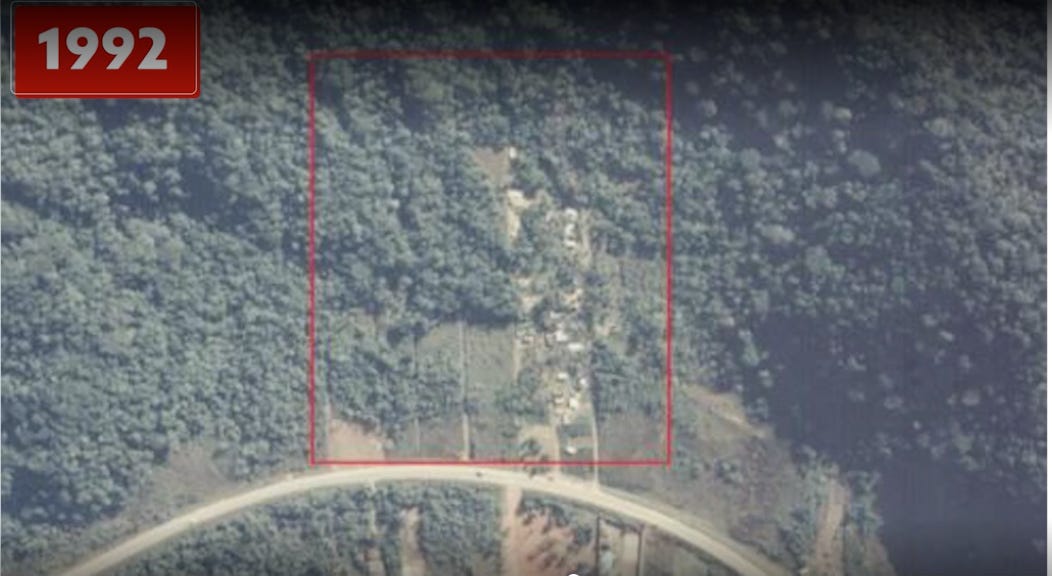
Here are too pictures of Vila Sahy, where most of the people died last year. In 1992, there were a few houses, I can count 23. By 2019, 648 homes and almost 800 families.
Vulnerability
Properties in Vila Sahy are irregular and illegally built. Most of the residents are poor and therefore more likely to build vulnerable structures on vulnerable property. Already in 1986 the Geographic Institute highlighted Vila Sahy at a high risk of landslide and more recently produced the below report with medium, high and very high risk residences:
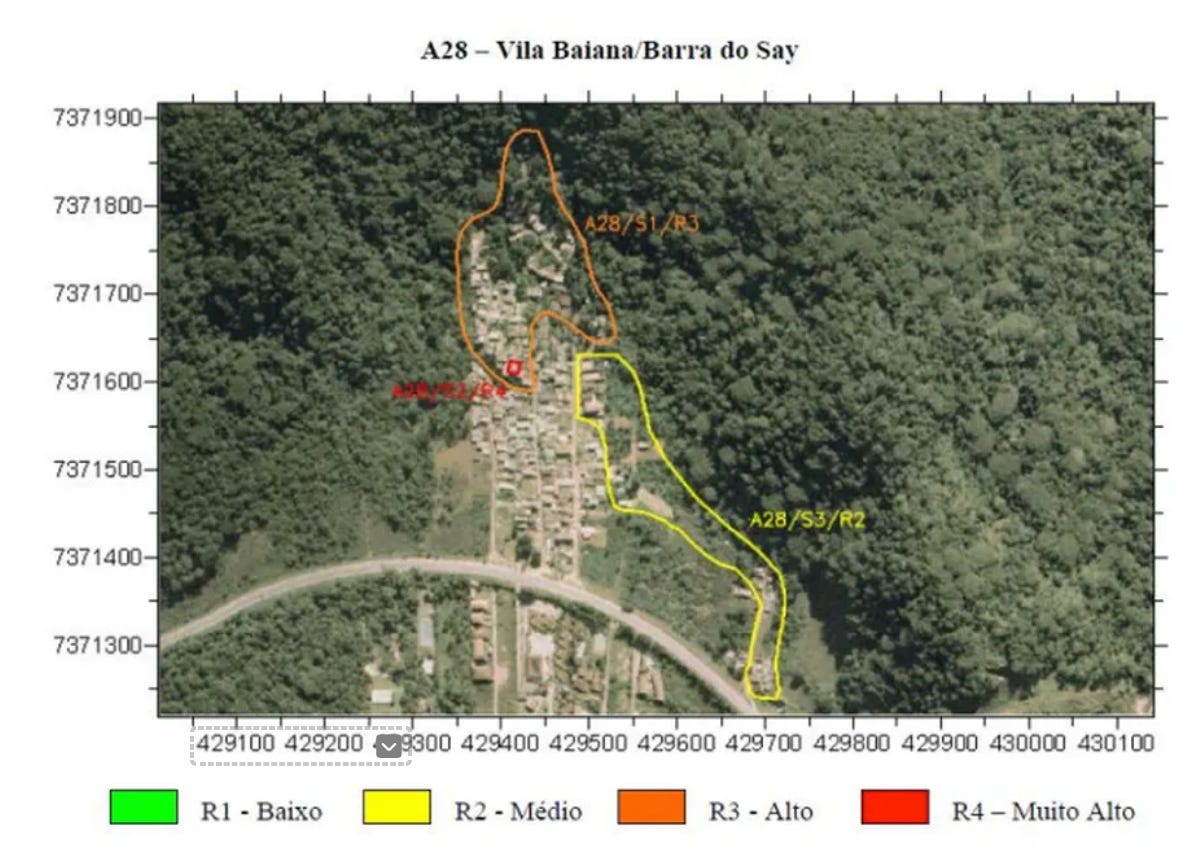
Figure 3. below zooms in on all the landslide failures and overlays them on a map of areas prone to risk. All of the risk prone areas were known and documented before the disaster of February 2023.
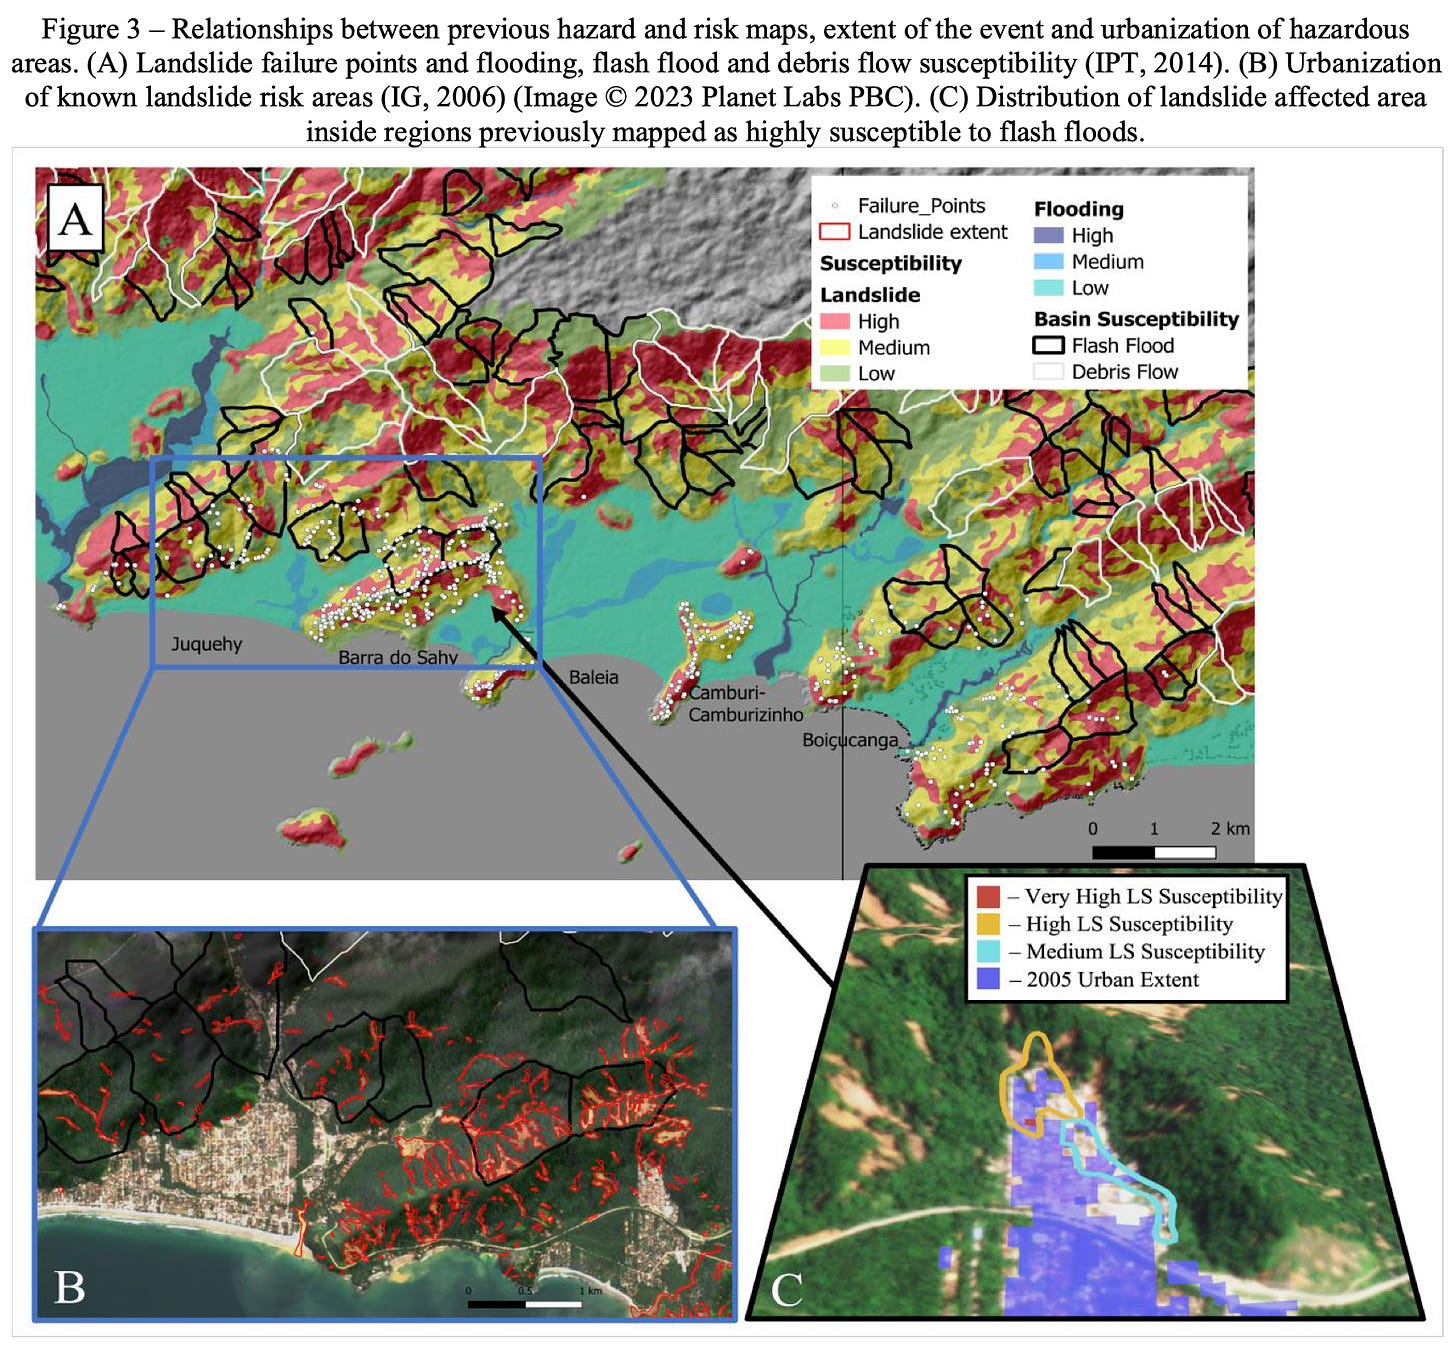
In 2009, and renewed in 2014, the State of São Paulo charged the mayor of São Sebastião for failing to regularize properties and remove vulnerable homes. In a subsequent report in 2021, the State of São Paulo declared that Vila Sahy was a “disaster waiting to happen”. The mayor ignored the report once again, despite the municipality of São Sebastião accumulating 37 sentences in 3 years for negligence in its management of Vila Sahy.
Ten years prior to the disaster that did happen, the State of São Paulo approved R$ 10,4 billion (~ U.S. $2 billion) for natural disaster prevention but only spent R$ 6,4 billion - 62% of the total. Seven years ago the State had approved and received finance by the Interamerican Development Bank to move the entire Vila Sahy community to another location, but the project never moved forward.
In turn, the municipality of São Sebastião only spent 5% of its disaster prevention budget on actual disaster prevention, the rest was spent on rent and salaries (for what end one wonders?!).
Disaster Risk in Practice
The impact of anthropogenic climate change on precipitation in São Sebastião is uncertain at best. Globally and regionally, the IPCC has not detected, attributed or predicted an upward trend in landslides due to climate change.4 The role of climate change in the São Sebastião disaster is riddled with uncertainty.
We are certain, however, that exposure and vulnerability did play a role in the disaster. Before 1985 virtually no homes existed on the hillside that collapsed on Vila Sahy - there was no Vila Sahy! In addition, Vila Sahy was constructed illegally on risk-prone land, exposed to an expected and anticipated hazard.
The question for determining climate risk is: how would the disaster have been different had climate change not been a factor? Had the 1967 rains in Caraguatatuba (585mm in 48 hours) hit São Sebastião in 2023 would the outcome of the disaster be different?
In São Sebastião, exposure and vulnerability to landslides are so high that in a stable climate (without anthropogenic climate change) it’s possible, if not likely, the Vila Sahy tragedy would have been exactly the same.
Yet, somehow, it is convenient (especially to political authorities)5 to emphasize the nebulous uncertainty of climate and underplay what we know with confidence: human decisions, policies and (in)actions to address vulnerability.
The reason uncertainty wins the narrative day will be the focus of my third and last post on climate risk.
[2] Last year, I did find an alternative precipitation record for Brazil in the Amazon region, I can’t find it now but will keep digging. Kobayama’s paper does an excellent job of documenting precipitation in February of 2023, but lack’s context of IPCC global and regional precipitation trends. Both the papers cited in this post, Carmona et al. and Kobayama, wherein the extreme precipitation in Sao Sebastiao is attributed to climate change (too quickly in my view), recognize the crticial role of social-economic drivers as causes of the disasters.
[3] For an apples to apples comparison, Caraguatatuba municipality in the 1960’s had a population of under 10,000 people, of which less than half lived in urban areas. See “A EXPANSÃO URBANA DE CARAGUATATUBA (1950-2010): UMA ANÁLISE DAS TRANSFORMAÇÕES SÓCIO ESPACIAIS”
[4] The IPCC recognizes climate change will increase precipitation globally and in southeastern Brazil, but sees no detection to date. It is possible the Feb. 18, 2023 rains will become part of the record for future IPCC detection and attribution.
[5] “O Prefeito Felipe Augusto encerrou sua participação no evento com um apelo à ação coletiva: “Juntos, podemos moldar um futuro mais resiliente e seguro para nossas cidades. É nossa responsabilidade enfrentar as mudanças climáticas de forma determinada, investindo em tecnologias e estratégias que nos ajudem a proteger nossas comunidades e nosso meio ambiente.” https://litoralnorteweb.com.br/prefeito-de-sao-sebastiao-aborda-a-resiliencia-climatica-na-pqtec-innovation-week-2023/

